Largest Contentful Paint: Why Site Speed Costs You Sales
What Largest Contentful Paint measures, what a good score is, and how we track LCP, INP and CLS from real visits for every site we look after.
Ask a client what "a fast website" means and you will hear something like "it comes up quickly". That instinct is right, and Google has turned it into a measurement with a name: Largest Contentful Paint, or LCP. It is the single most useful speed number a business owner can learn, because it measures the moment a visitor stops staring at a blank screen and starts reading.
This article explains what LCP actually is, what a good score looks like, why it costs you money when it is poor, and how we keep an eye on it for every site we look after inside our own GoGee.ai technology.
What Largest Contentful Paint Measures
LCP is the time from the moment someone asks for your page to the moment the biggest visible thing on the screen has finished drawing. On most sites that "biggest thing" is the hero image at the top, or a large headline, or a video poster frame.
It is a deliberately blunt measure, and that is the point. Older speed numbers told you when the server responded or when the browser finished a technical milestone the visitor cannot see. LCP asks a human question: how long before there is something real on the screen?
Two things follow from that. First, LCP is about the top of the page, not the whole page. Second, it is measured per visit, so the same page can be quick for one person and slow for another depending on their device, their connection and where in the world they are.
The Numbers That Matter
Google publishes the thresholds, and they are not negotiable:
- Good: 2.5 seconds or faster.
- Needs improvement: between 2.5 and 4 seconds.
- Poor: slower than 4 seconds.
There is one more rule that matters more than most people realise: the verdict is taken from the 75th percentile of visits, not the average. In plain terms, three out of four visits must be under 2.5 seconds before a page counts as good.
Averages lie about speed. A handful of very fast visits from a fibre line in Johannesburg will happily hide a large group of visitors on mobile data who are waiting eight seconds and leaving. The 75th percentile refuses to hide them, which is exactly why we report on it.
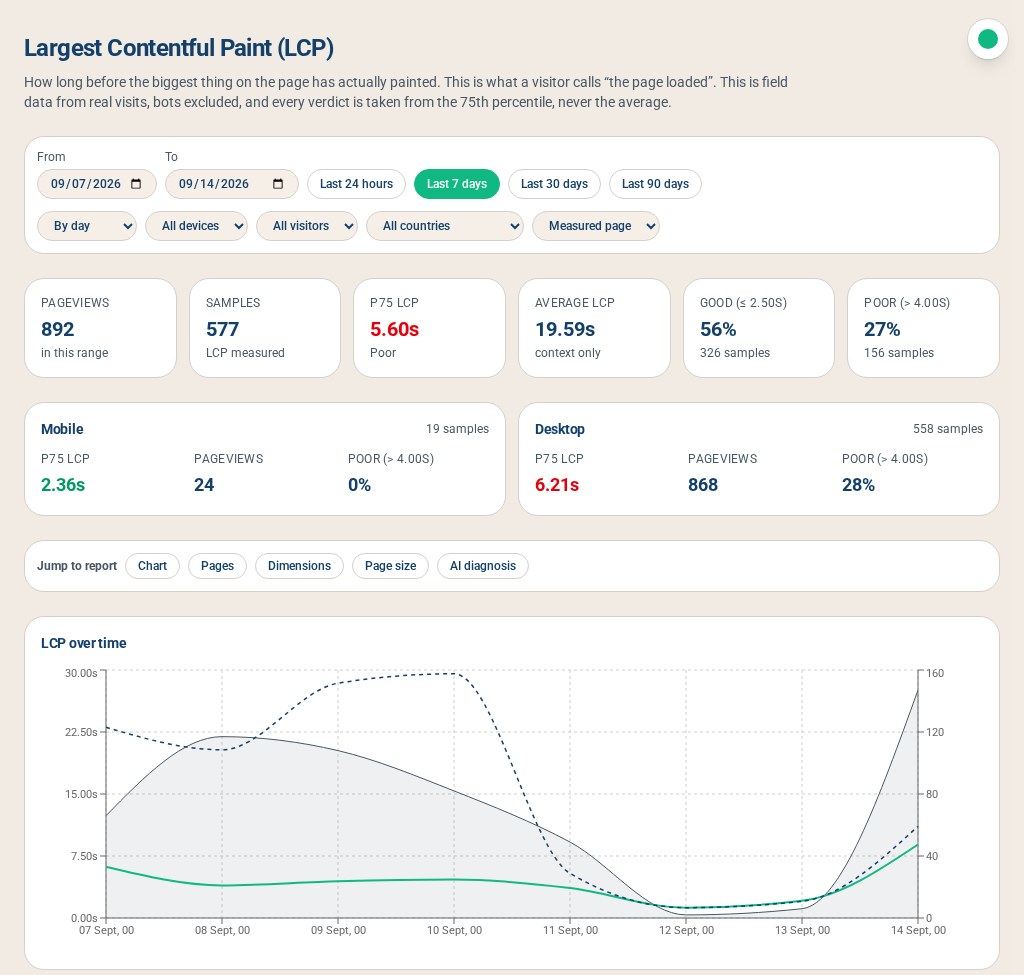
That screenshot is worth a moment, because it shows why one headline number is never enough. Judged on its own, this site looks poor. Split by device, mobile is good and desktop is the problem, and the fix belongs on the desktop experience only. Without the breakdown, you would spend weeks optimising something that was never broken.
Why Speed Is a Money Question
Speed is not a technical vanity metric. It sits directly in front of every other thing you spend money on.
If you pay for advertising, you are paying for the click whether or not the page appears. A slow page means you buy the visitor and then lose them before they have seen your offer. The same is true of every email, every social post and every hard-won search result.
Search itself is affected too. Google uses page experience, and LCP within it, as one of the signals it considers when ranking pages. It will not push a bad page to the top because it loads quickly, but between two comparable pages, the slow one loses.
And then there is trust. People read a slow site as a badly run business long before they can explain why. That perception is expensive and nobody ever fills in a contact form to tell you about it.
What Usually Makes LCP Slow
In our experience, poor LCP almost always comes down to a short list of causes:
- An oversized hero image. A 4 MB photograph exported straight from a camera or a stock site, displayed at a fraction of its real size. This is the most common cause by a distance.
- A slow first response. Cheap or overloaded hosting, a database doing too much work, or a page that is rebuilt from scratch for every visitor instead of being cached.
- Blocking fonts and scripts. Custom fonts and third-party tags that must download before anything is allowed to paint. Chat widgets, tag managers and tracking pixels are frequent offenders.
- Images loaded too late. Ironically, "lazy loading" applied to the hero image itself delays the very thing LCP measures.
- Layout that waits for data. A page that renders empty and only fills in once information arrives from somewhere else.
None of these are exotic. All of them are fixable, and most are fixable in hours rather than weeks once you know which one you have.
LCP Does Not Travel Alone
Google measures three things about the experience of a page, and they answer three different complaints.
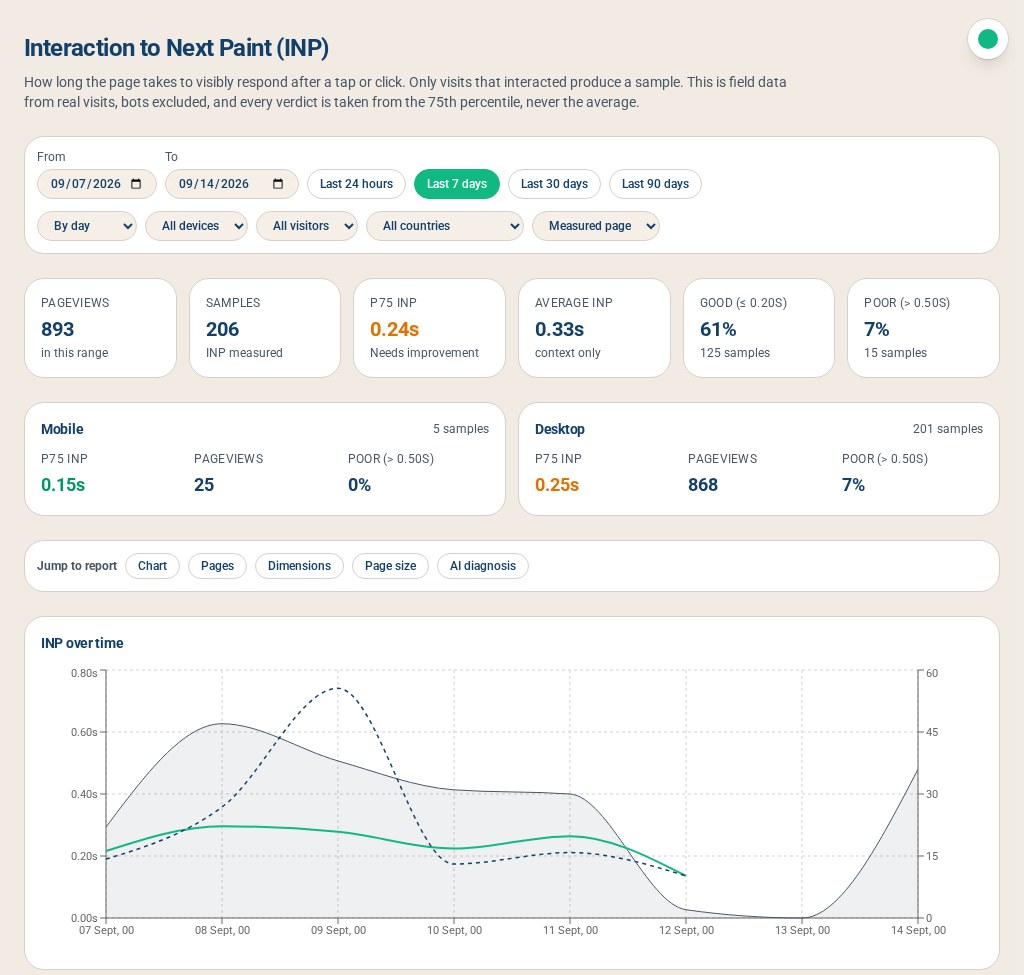
Interaction to Next Paint (INP) answers "I tapped it and nothing happened". It measures how long the page takes to visibly respond after a tap or a click. Good is 200 milliseconds or less, poor is beyond 500.
Cumulative Layout Shift (CLS) answers "I went to press the button and the page moved". It measures how much the layout jumps around while loading, usually because an image or advert has no space reserved for it. Good is 0.1 or less, poor is beyond 0.25.
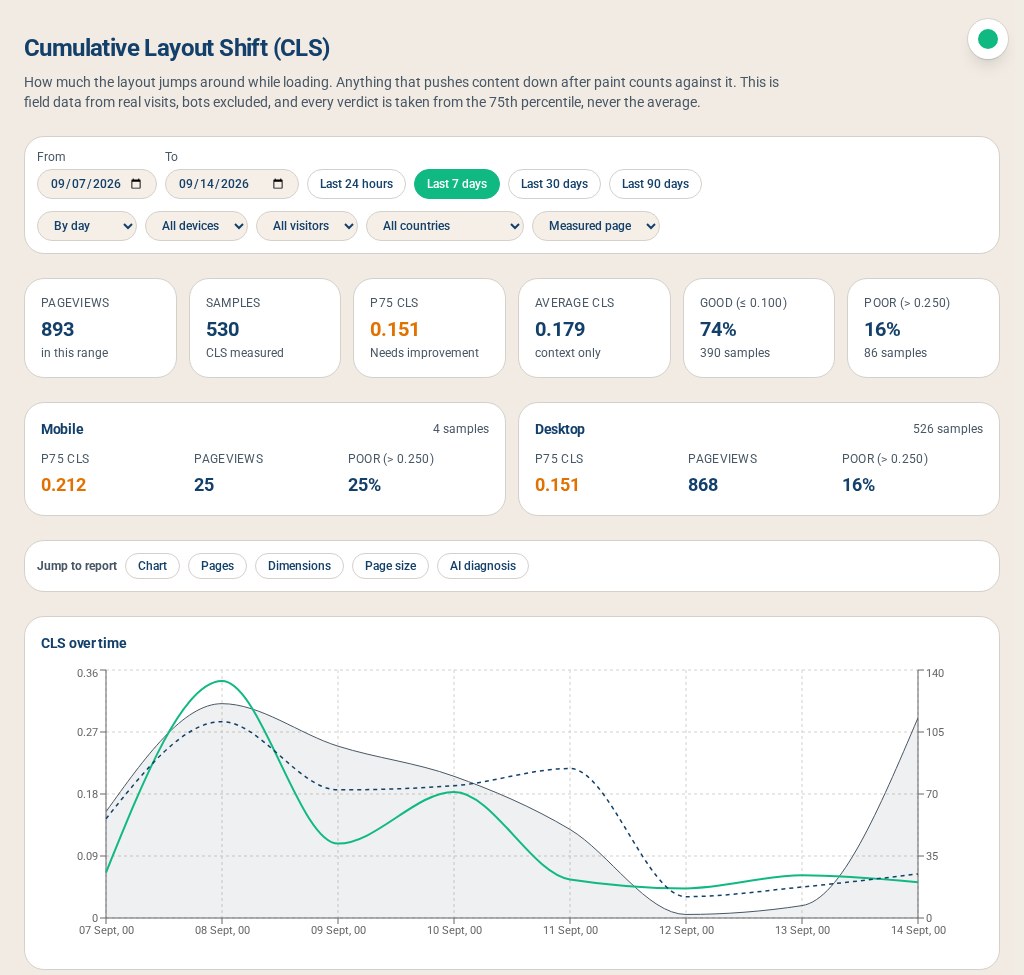
Taken together the three tell one story: did the page appear quickly, did it respond when touched, and did it hold still while being used? A site can pass one and fail the others, which is why we report on all three rather than picking a favourite.
How We Keep Watch
There are two ways to measure speed, and the difference matters enormously.
A lab test loads your page once, on a simulated device, from a data centre, and gives you a score. It is useful for finding causes, and it is what most speed tools give you. It is not what your customers experienced.
Field data is the measurement taken from real visits by real people on their real phones and connections. That is what our monitoring collects. Every visit quietly records its LCP, its INP and its CLS, along with page weight and how large the page grew, and sends the numbers when the visitor leaves the page. Nothing is guessed and no separate test needs to be run.
Because it is tied to real visits, we can slice it the way a business thinks:
- By page, and separately by the page people arrived on, so we can tell a slow landing page apart from a slow site.
- By device, browser and operating system, which is how the desktop problem in the report above became obvious.
- By country and region, because distance costs time.
- By marketing channel, source and campaign, so we can see whether the traffic you are paying for is the traffic having the worst experience.
Every figure carries its sample count alongside it. A 75th percentile drawn from six visits is not a finding, it is noise, and pretending otherwise is how people end up rebuilding things that were never broken. Bots are excluded, because a crawler's experience is nobody's experience.
A Practical Checklist
If you want to improve your own LCP, start here, in this order:
- Find your real number from field data, not a single lab test, and look at the 75th percentile.
- Split it by device. Mobile and desktop usually have different problems.
- Compress the hero image, serve it in a modern format, and size it for the space it occupies.
- Make sure the hero image is loaded eagerly and given priority, not lazily.
- Delay every third-party script that is not needed for the first screen.
- Reserve space for images and adverts so nothing jumps once they arrive.
- Check hosting and caching if the page is slow before a single image has downloaded.
- Measure again a week later, on real visits, and confirm the 75th percentile actually moved.
Want to Know Your Number?
Most businesses have never seen their real Largest Contentful Paint, only a one-off score from a free tool that tested a page from another continent. If you would like to know what your visitors genuinely experience, and which pages, devices and channels are costing you, we are happy to measure it and show you.
Speed is one of the few improvements that helps everything else at once: your advertising, your search visibility, your enquiries and the impression you leave. It is worth knowing where you stand.